The Query Behind the Viz
Several posts here have explored the queries Tableau generates as it builds your viz, including last week's write-up on custom SQL. This is a trend that will continue: it's much easier to understand a machine when you can see its inner workings.
But how do I get at those queries? I was talking with Yvan Fornes, and he suggested that I write about how I do it.
Challenge accepted! Except I may have gone overboard: in this post I'll explore three ways to find the queries underlying your viz.
Setup
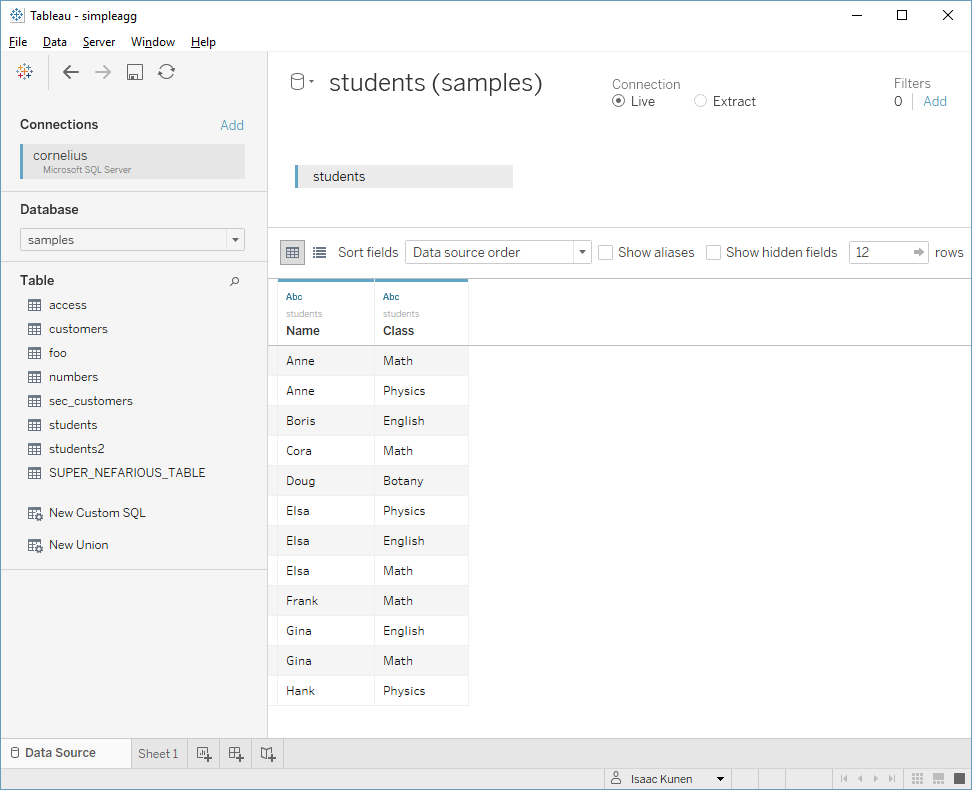
To illustrate things, I've built a very simple viz against a very simple table I have in SQL Server. Here's the data source—twelve rows in all their glory.
And here's the viz—I'm counting students by class:
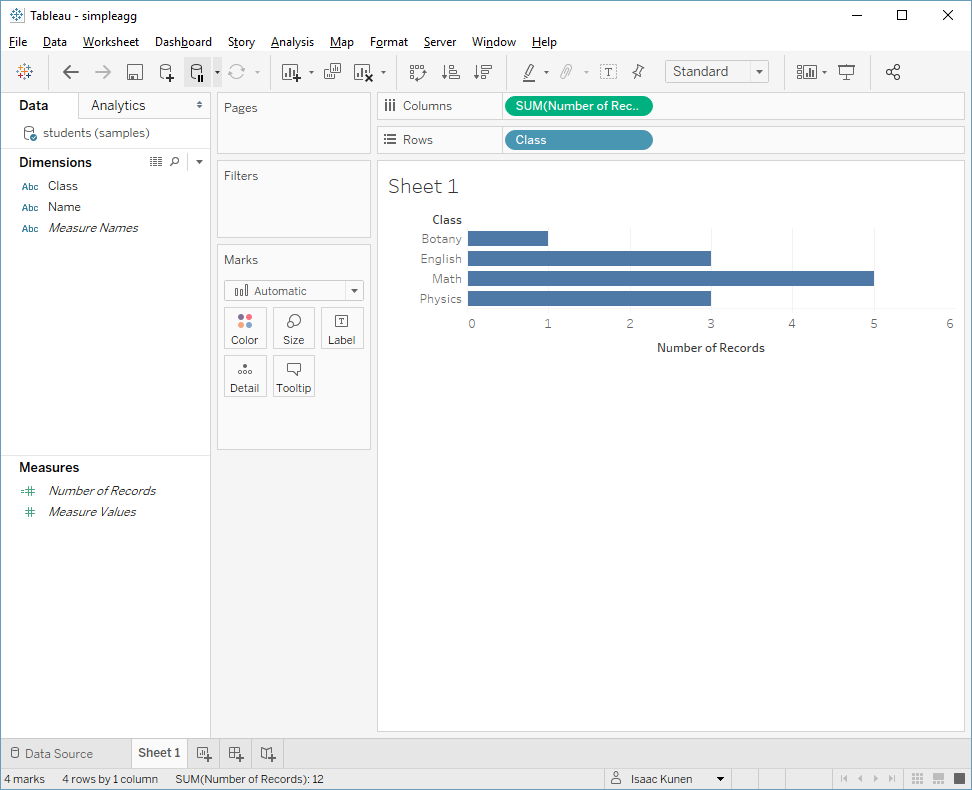
With these, I'm going to show how to find out what query is issued when I refresh the view:
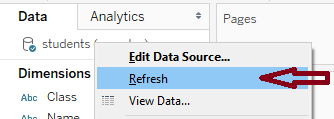
I'm going to walk through these with my setup, but you can do this with your own favorite viz just as well.
Method 1: Look to the Logs
Tableau logs all of the queries it issues, plus a lot of diagnostic information along the way. In theory, you could read look through these logs with a text editor, but you don't want to do that.
Instead, head on over to GitHub, where you can find the Tableau Log Viewer. You can clone the project if you want to build it yourself, or grab a prebuilt copy from the releases folder like a normal human being.
Once you have this installed, go ahead and start it up. You should see a screen like this:
You can use this to read through historical logs, but there are a lot of events, and narrowing it down to what we care about can be hard. Instead, we'll use Live mode and capture the events that result from our refresh as they happen.
So lets capture some logs! If you've pre-loaded your workbook in Tableau, the first thing to do with TLV is to open your logs, which should be in My Tableau Repository\Logs\log.txt. This will load a lot of noise, but once you have that open, you can:
- Start live mode.

- Clear out any history that you have, leaving you with a nice, blank starting state. Don't worry: this will only clear what's loaded in TLV, not the log file on disk.

- Switch over to Tableau and refresh the data source.
- Come back to the Log Viewer and turn off live mode.
Now we have a mess of log entries. It can be a bit overwhelming. But we're interested in the queries we're issuing, so let's scan for a begin-query event...
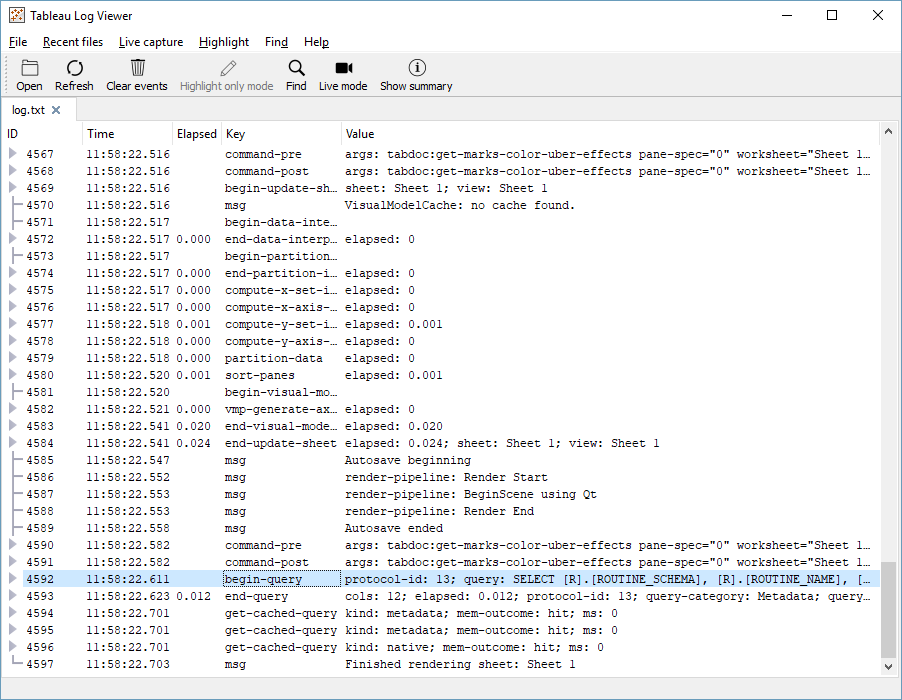
Now we can right-click on it and ask to "Highlight all events of this type".
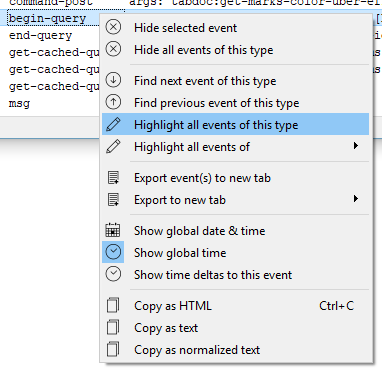
This will make it easier to see the relevant events. Even so, there will likely be a few queries to wade through, but it shouldn't be too overwhelming. You can double-click on an entry to see more details. As you hunt through the list, you may see a number of entries like this
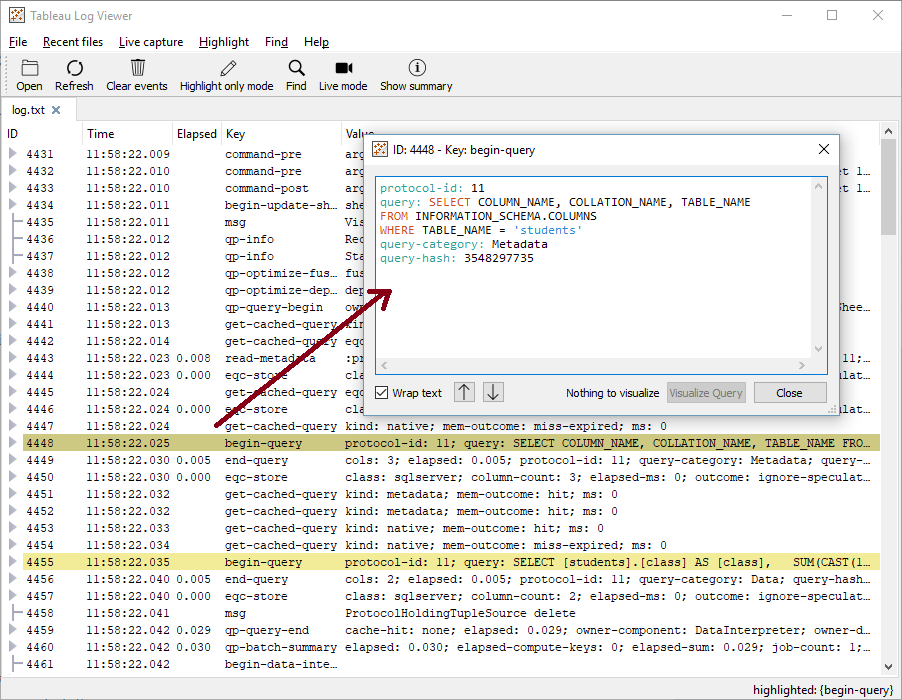
that query the system for metadata needed to understand the server. But you should also have the query for your data source. In my case, this is the second begin-query element:
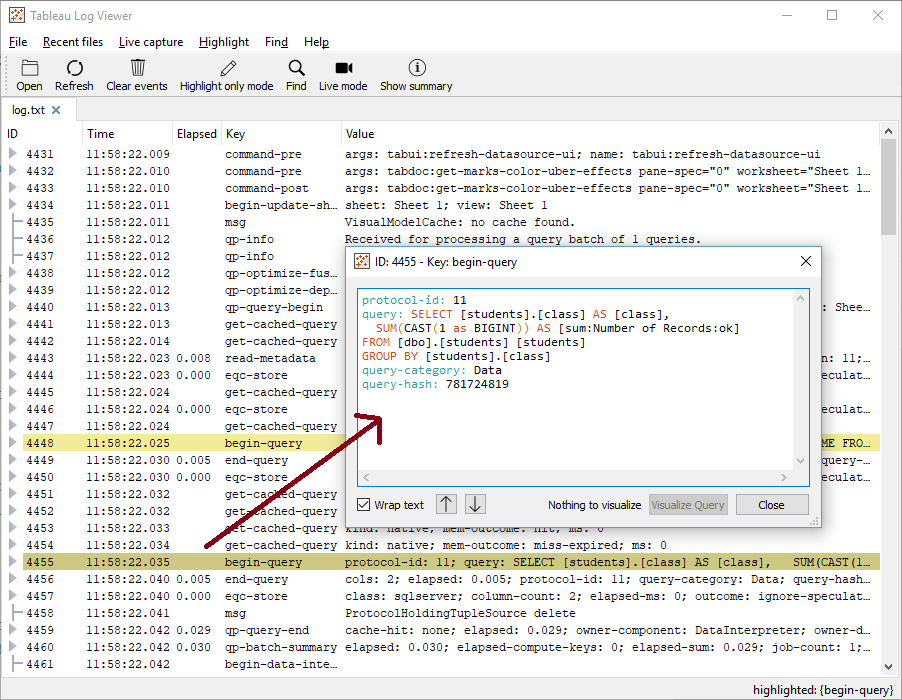
That's it: if you've read my blog entry on dimensions and measures, you should recognize this as the query populating my simple viz.
Method 2: Tableau Performance Recorder
Another Tableau-provided tool is the Performance Recorder built right into Tableau. This has the advantage of being built-in and potentially simpler to use than the Log Viewer.
To use the Performance Recorder for our example, we open up our viz, and then:
- Start the recording by clicking Help→Settings and Performance→Start Performance Recording.
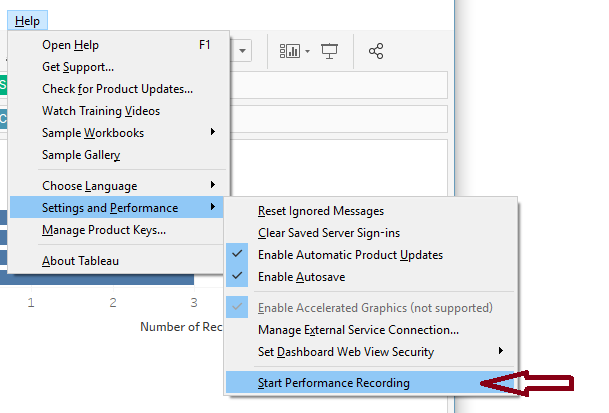
- Refresh the data source as before.
- Stop the recording by clicking Help→Settings and Performance→Stop Performance Recording.
Once you stop the recording, Tableau will take a moment to put the report together, and then open up a Performance Recording viz:
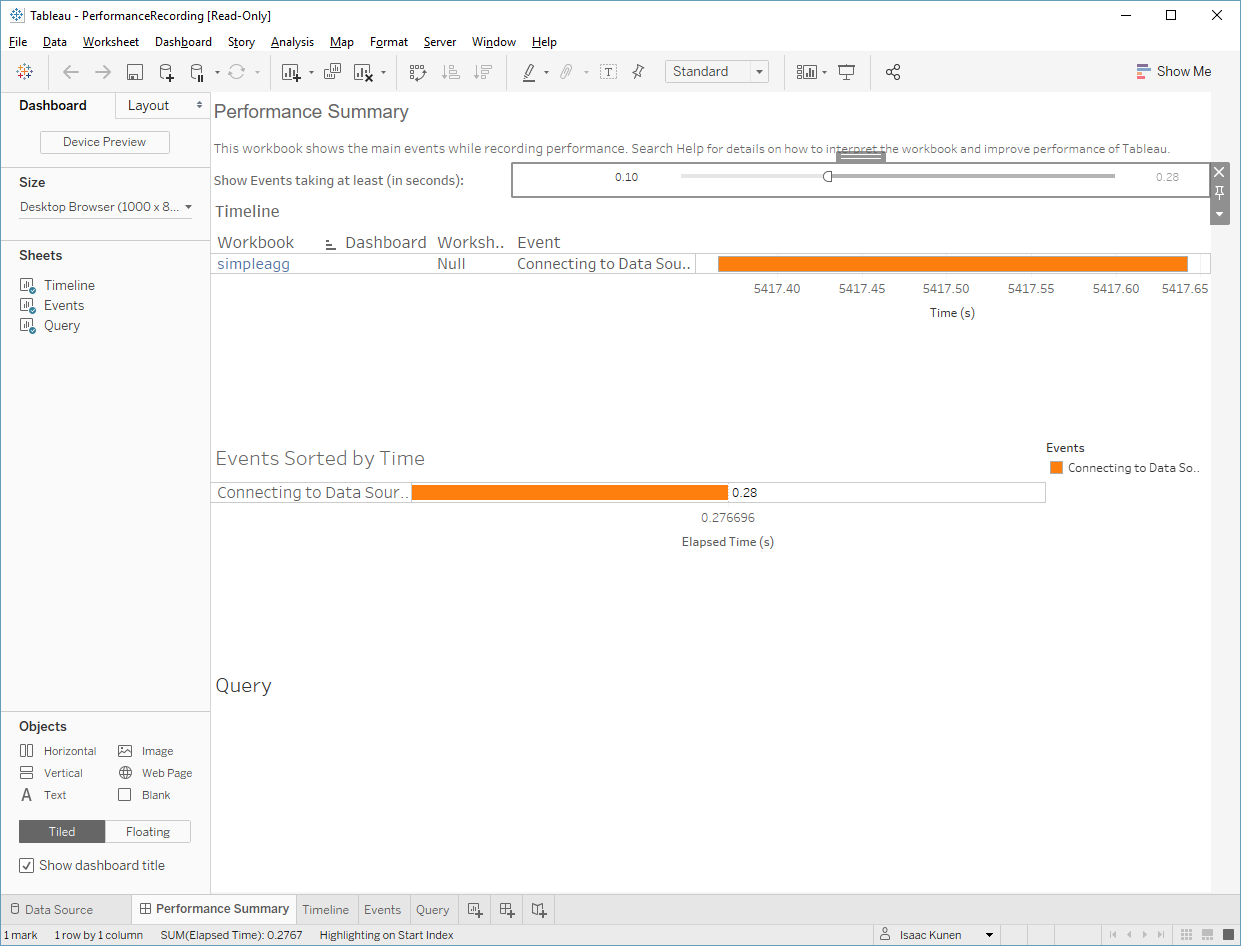
In our case, there's not much to see, because the query was so fast (a whole 12 rows!) and by default, the viz filters out events that take less than 0.1 seconds. To see what's going on, we have to edit the filter so that we can see our query—let's see everything:

Now we can see a set of query events. We can click on one to see its text. Even though it's quick, the longest duration query is the one we want:
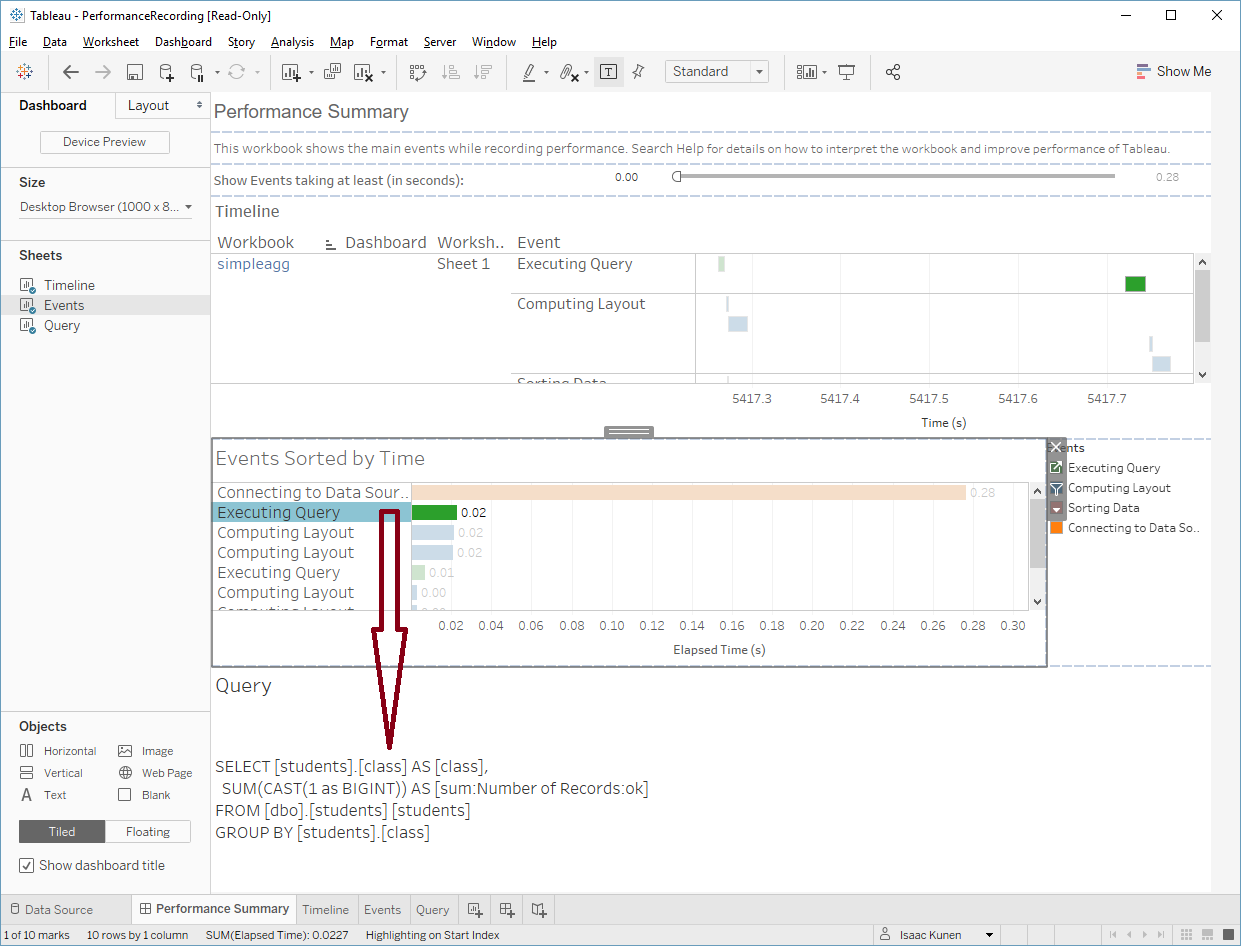
This was a simpler task to complete, but I find it easier to understand everything that's going on using the Log Viewer. Ultimately, though, this is up to personal preference and the task at hand.
Method 3: Database-Specific Options
If you've been reading along, you may notice that in my posts I've used neither of the approaches above, and have instead used the SQL Server Profiler.
The primary advantage to the Profiler is familiarity—for me, anyway: I worked on SQL Server for a number of years, and I know its tools reasonably well. Profiler is also useful if you want to understand what's happening on the database side of the conversation, but for most cases this is likely to be irrelevant.
The downside to Profiler is that it only works with SQL Server. If you have another database, you'll have to learn whatever tools it happens to have. So I'd recommend using one of the alternatives above, but I'll give a brief show-and-tell for completeness.
I'll assume that Tableau is already open to your workbook. The first thing to do is to start Profiler and connect it to your SQL Server instance. Next, you want to start a trace—the defaults are good:
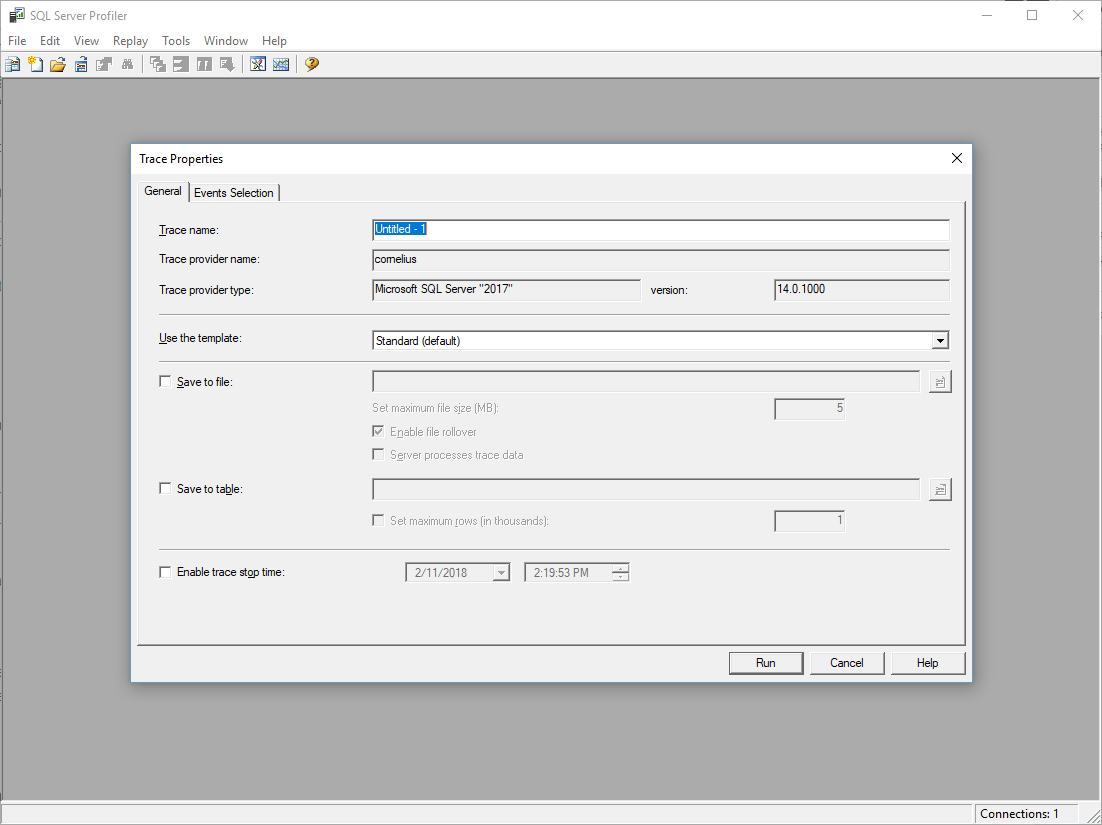
When you want to record your activity:
- Clear the current trace in Profiler.

- Switch over to Tableau and refresh the data source.
- Switch back to Profiler and pause the trace.

Now you have the view of the world from SQL Server's point of view. And as with the Log Viewer, there's a lot here:
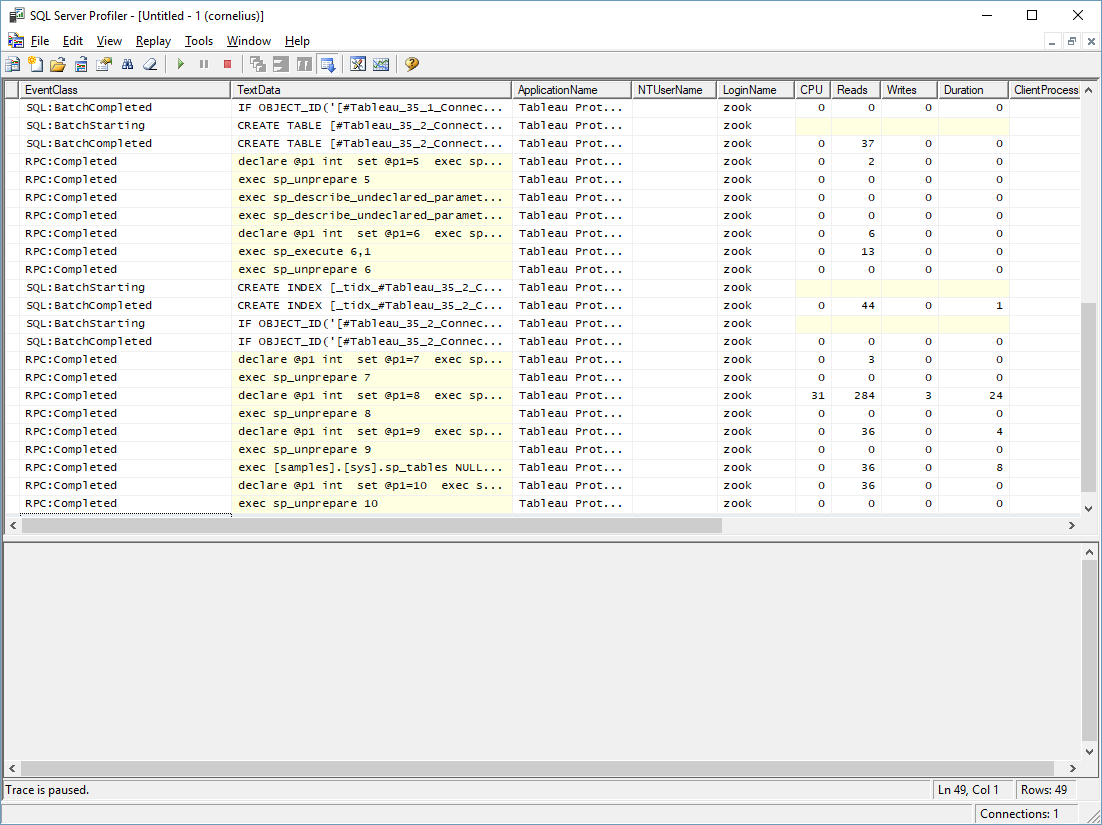
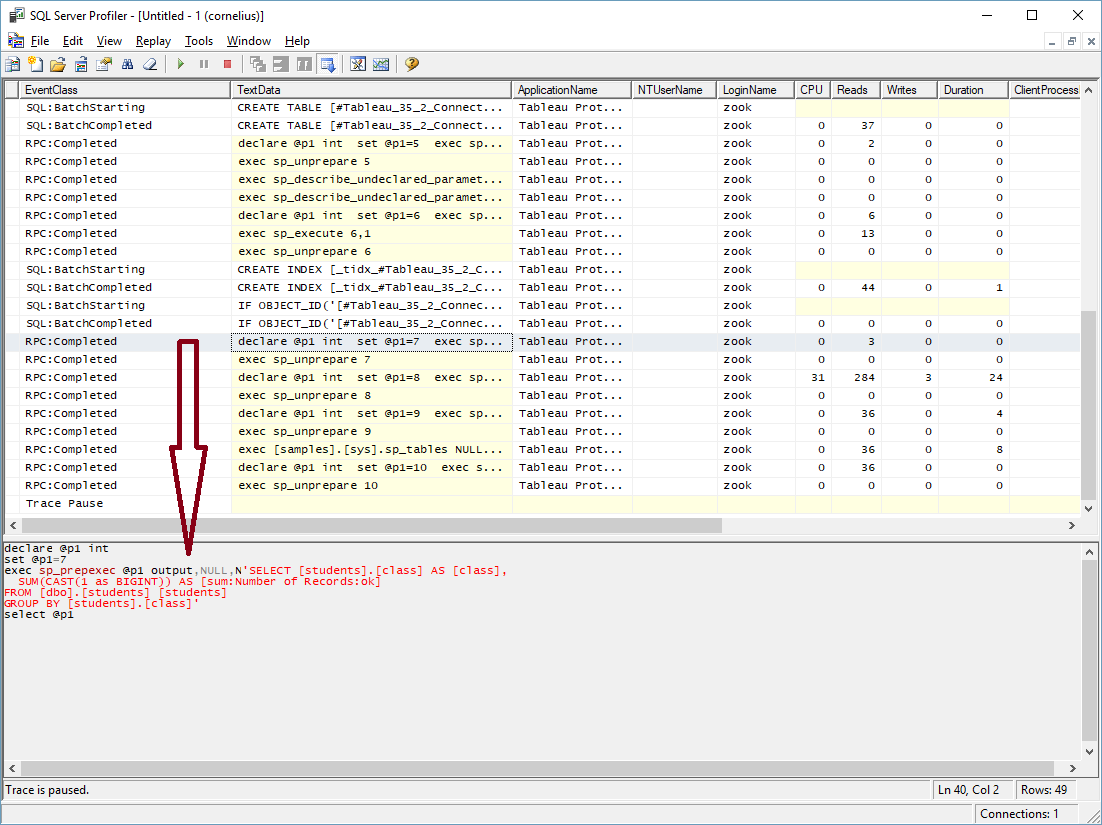
It can be a little hard to separate the wheat from the chaff. But after a little digging, we find our query buried in a sp_prepexec, and the whole statement starts with a declare:
Final Thoughts
There you are: more than you ever wanted to know about finding the queries underlying Tableau. Now maybe you can figure out what LOD calcs are really doing. If not, stay tuned and I'll share—once I wrap my head around them properly.

