
Tableau Prep: The Power of Composability
When we built Tableau Prep, we put a premium on ensuring composability of operations: you can take the operations Prep supports and string them together in any combination you need. There are no restrictions based on where the data came from, or what operations came before.
This means that you never need to think about whether a particular operation is supported in your particular situation: if Prep supports it ever, Prep supports it always. Moreover, this gives you a lot of power to do what you need to with your data.

In the rest of this post, we'll walk through a Superstore example that highlights this power.
The Problem
Let's start with the sample Superstore data from Tableau Desktop. This data set is a list of order details: each row represents one item from an order, with multiple line items accruing to each order.
Given these data, let's try to fulfill what seems like a simple request:
Get the order details for customers with fewer than the median number of orders.
This seems relatively straightforward... or is it? In cases like this, I often find it helpful to think backwards to come up with a solution:
- Step 4
- If we had a list of customers with fewer than the median number of orders, we could cull the order details down to just those from customers on the list. But we don't have a list of these sub-median customers.
- Step 3
- If we knew the median number of orders, we could prune the list of customers down to those with fewer than the median. But we don't have the median number of orders.
- Step 2
- If we knew the count of orders for each customer, we could aggregate it to find the median number of orders over all customers. But we don't have the number of orders for each customer.
- Step 1
- If we had the list of orders for each customer, we could aggregate to get the count for each customer. And we do have the order list!
Now we have a plan: we'll start with the order details we have, and climb the ladder outlined above to get to the solution.
The Solution
We start by loading the Superstore data: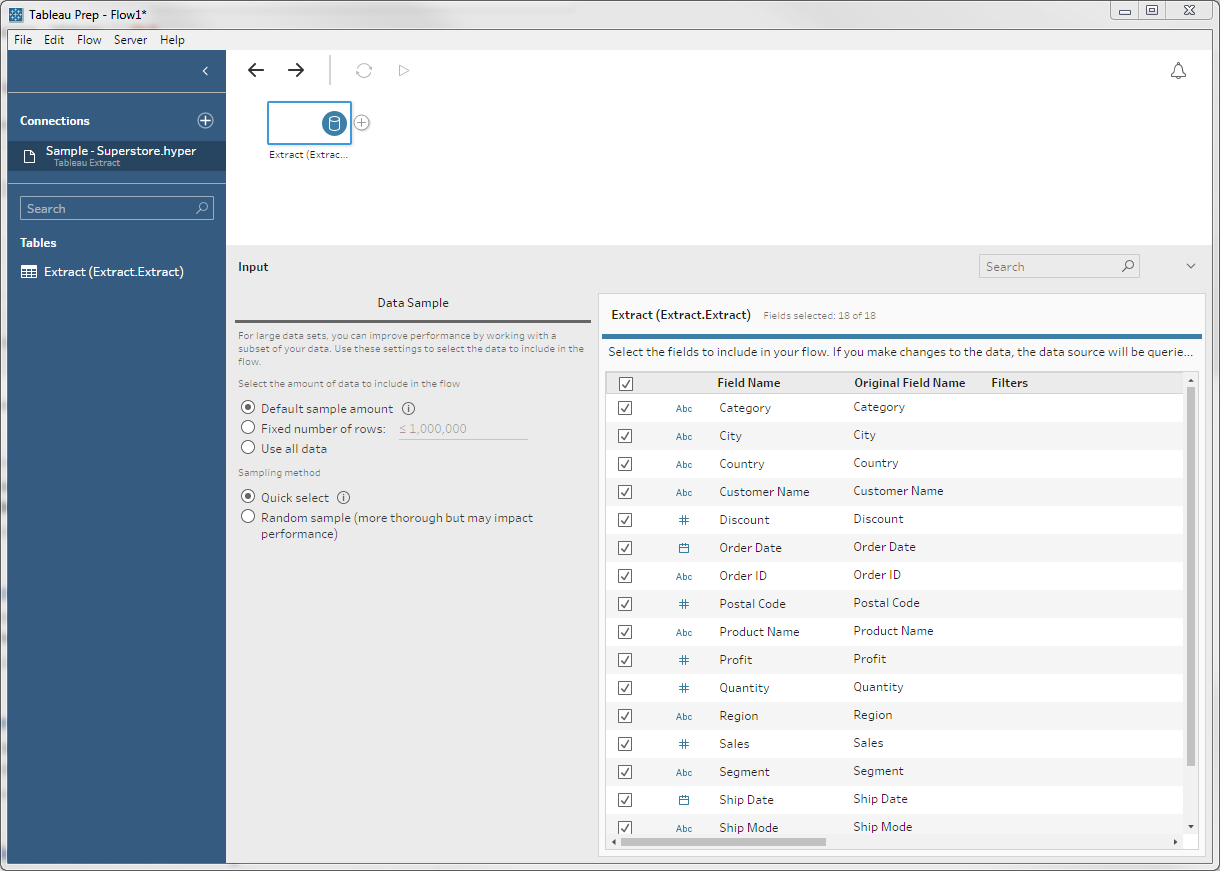
As we've already observed, these are order details. Each order has a distinct Order ID, but may have more than one line.
Step 1
Following our plan, the first thing we need to is get the count of orders for each customer. To do this we introduce an aggregate: we group by customer and count the distinct number of Order IDs: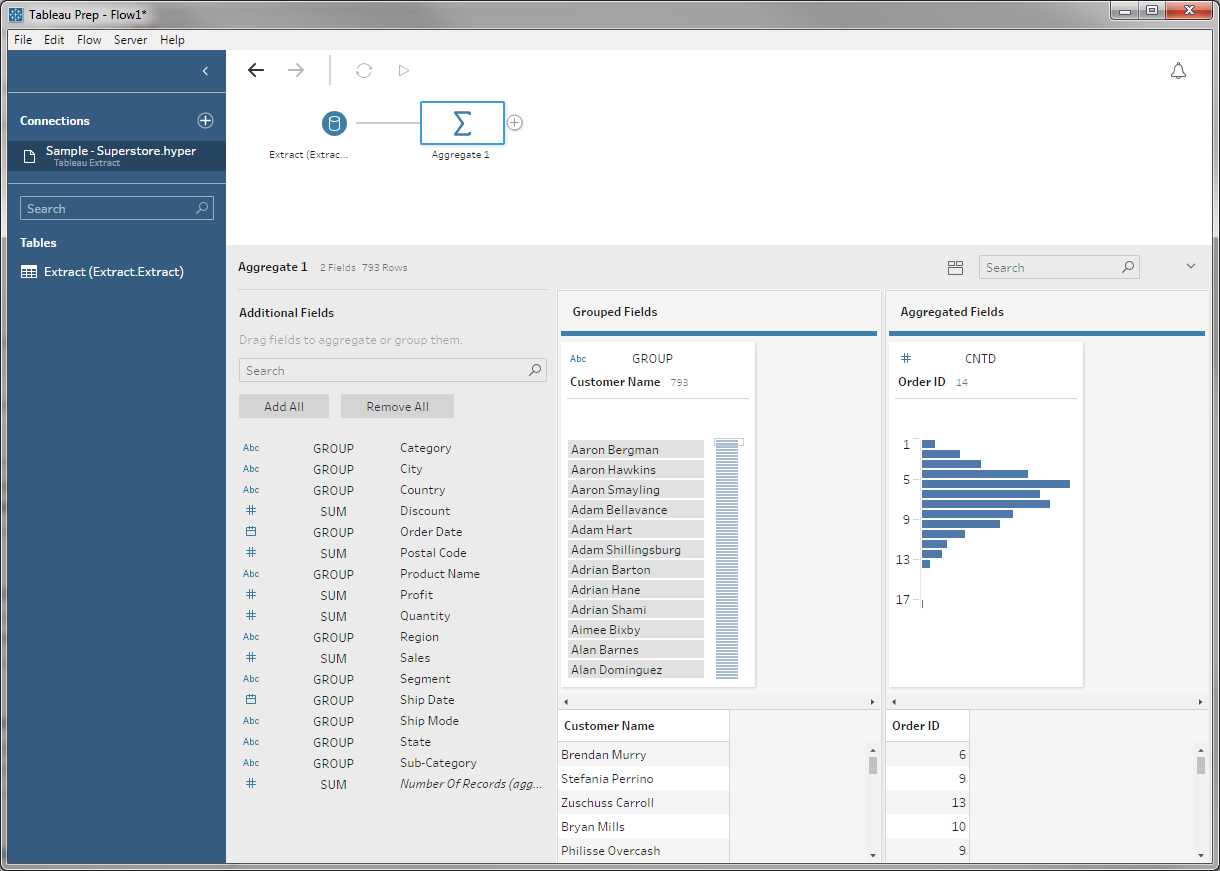
The distinct makes it so repeated Order IDs — which come from having more than one order detail line per order — are only counted once.
So we don't confuse ourselves later, we'll rename Order ID to Number of Orders: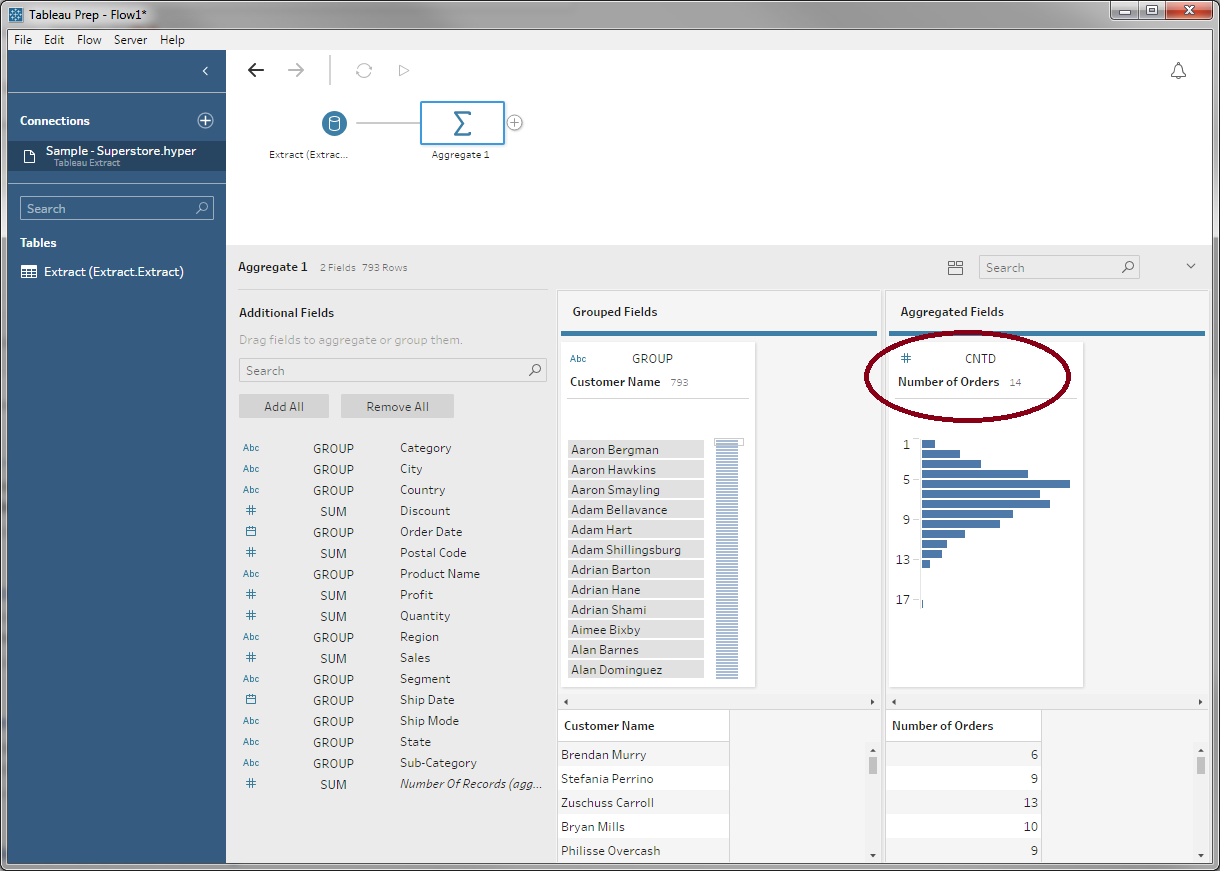
Step 2
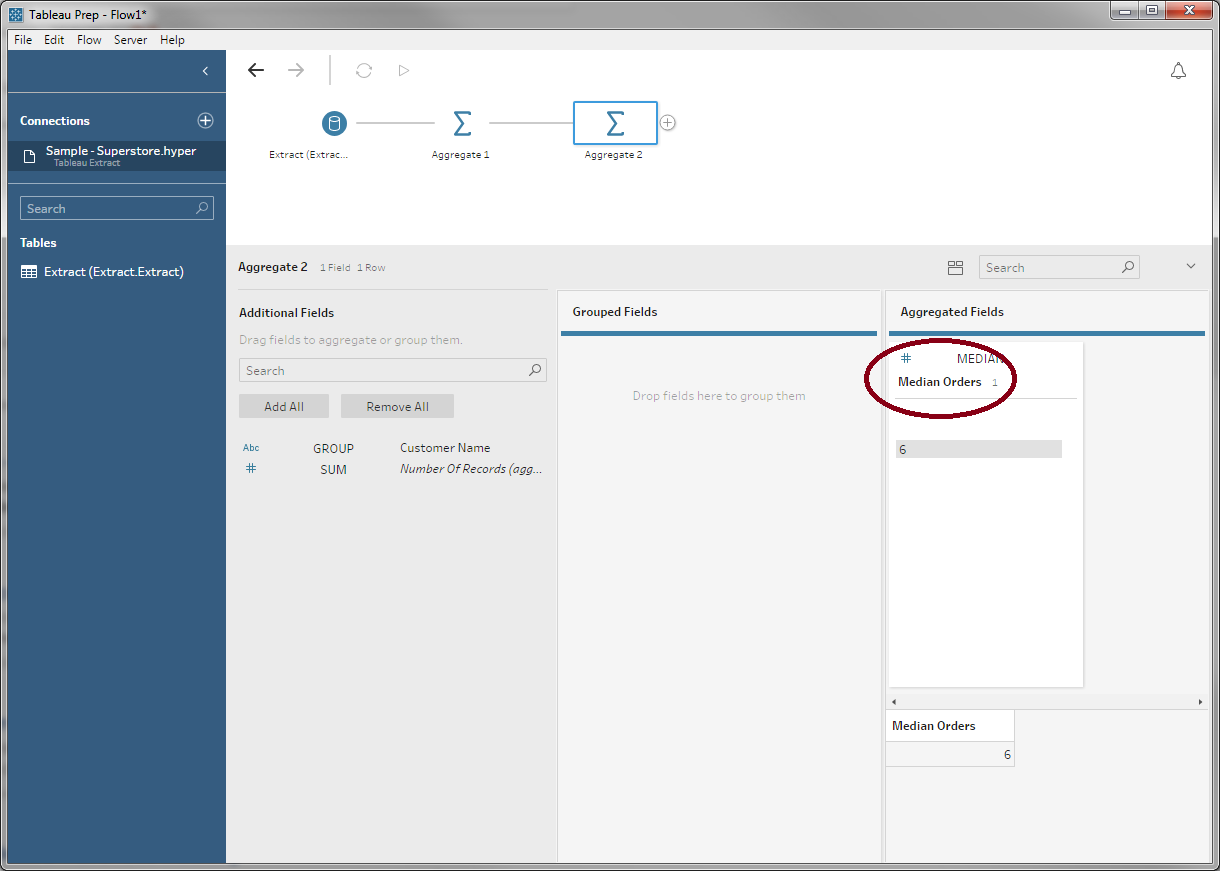
Now that we have the list orders for each customer, we can aggregate again to find the median number of orders per customer:
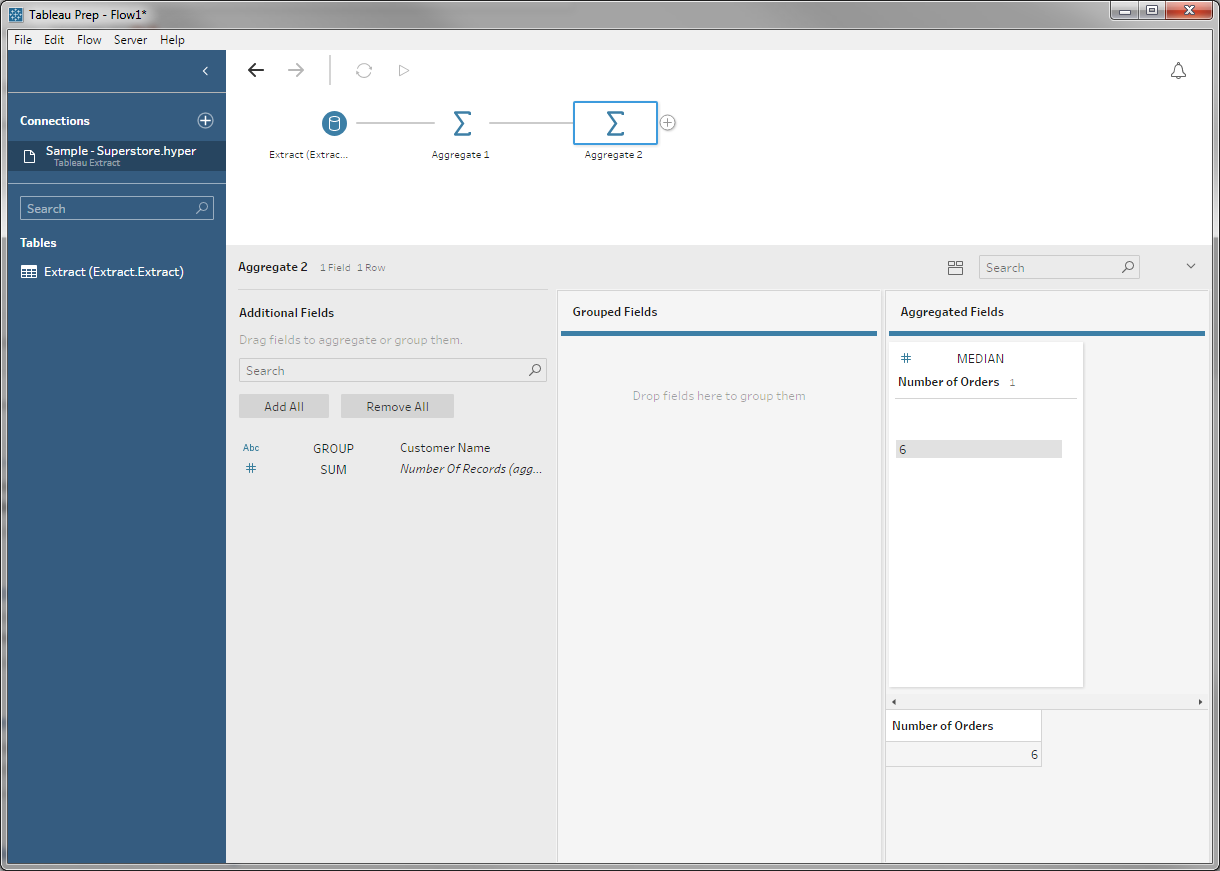
This aggregate is a little funny: There's no grouping field, so we don't partition the table at all. The result is an odd little table with one row and one column, but this record represents the median over all customers we were looking for.
We'll rename this once again:
Step 3
With the median number of orders in hand, we can join it with our list of customers and order counts to filter down that list. I.e., we'll join it with the result of our first aggregate:
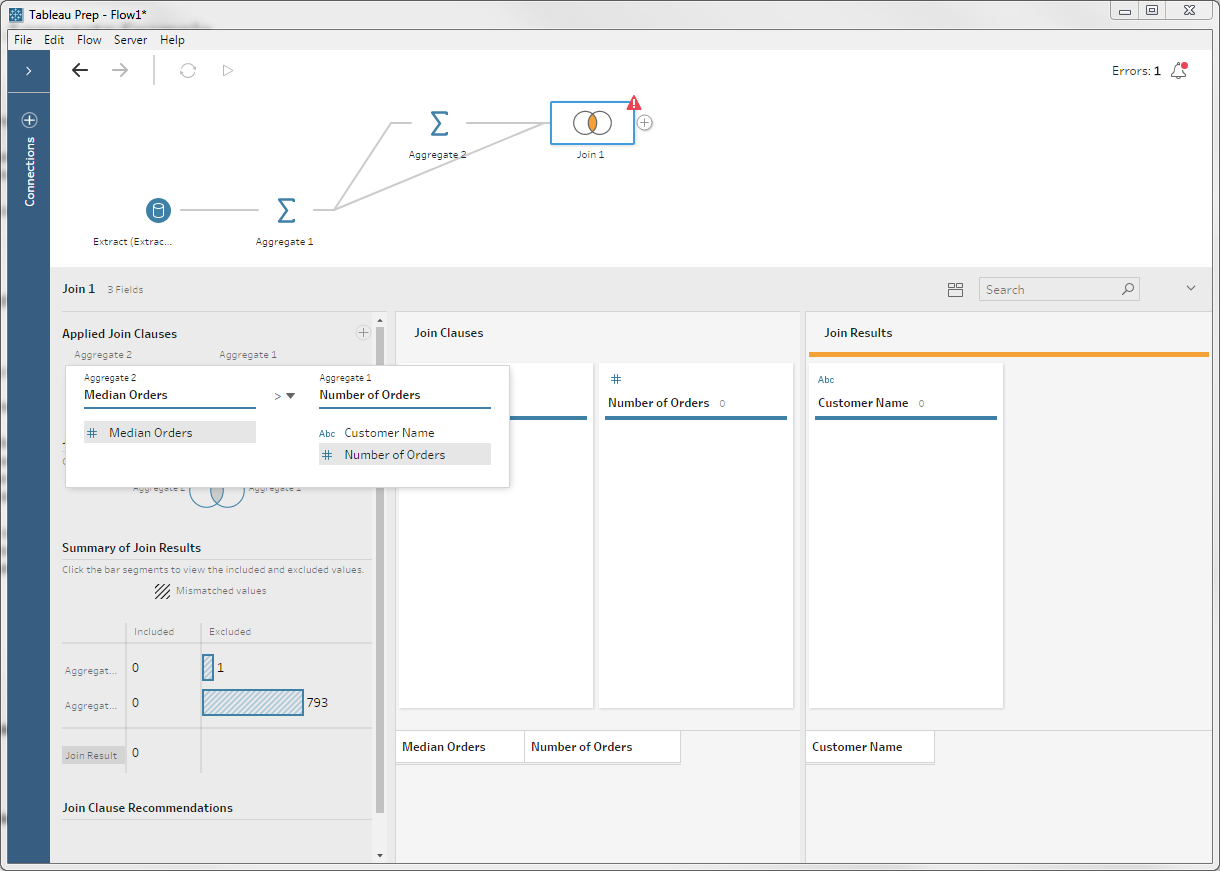
Note the join clause here: we're doing an inner join, but matching when the median is greater than the customer's order count. We also have an error: the types don't match because the result of the median is a floating-point number, not an integer.
If we correct the type, we get our list of customers with fewer than the median number of orders: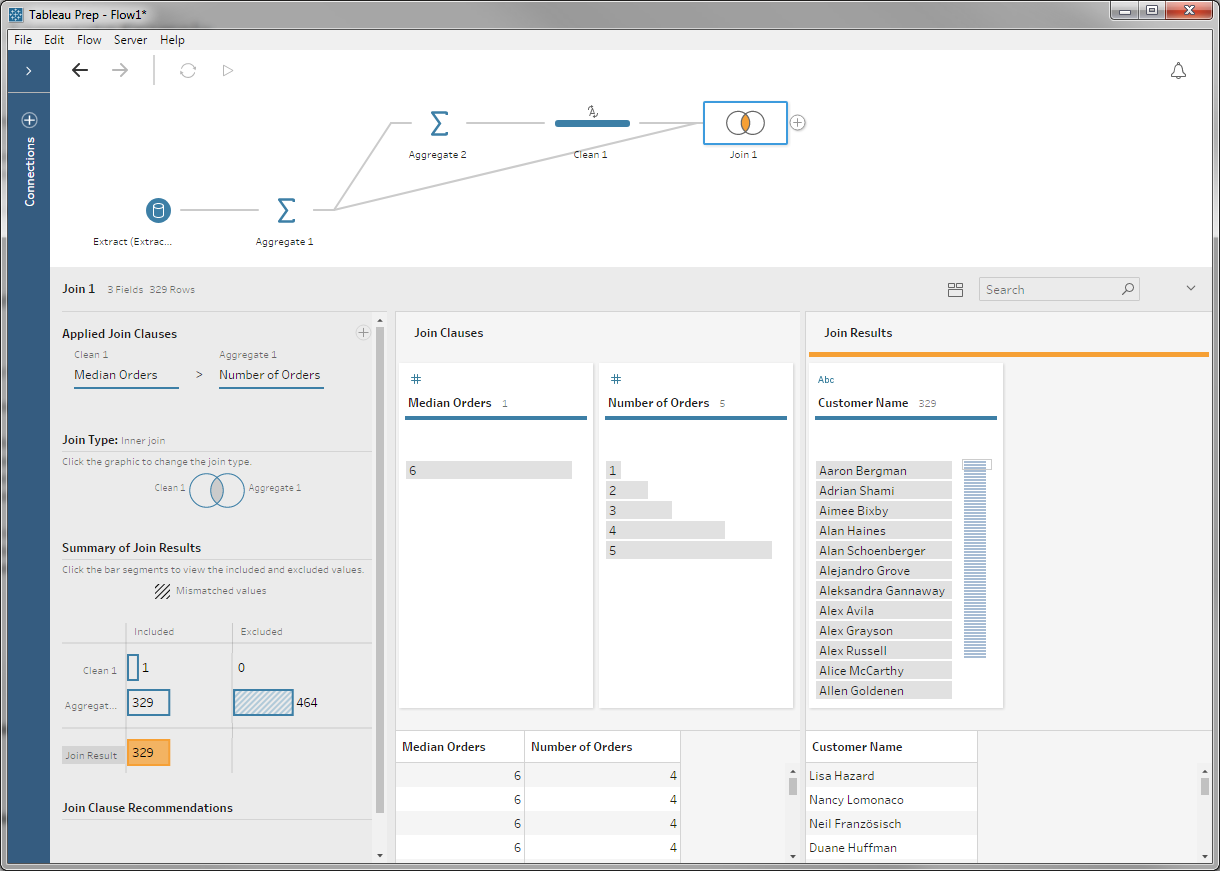
Step 4
Now that we have our customer list, we're ready to cull the line items. We'll again use a join as a filter, but this time we're joining our latest table with the original input:
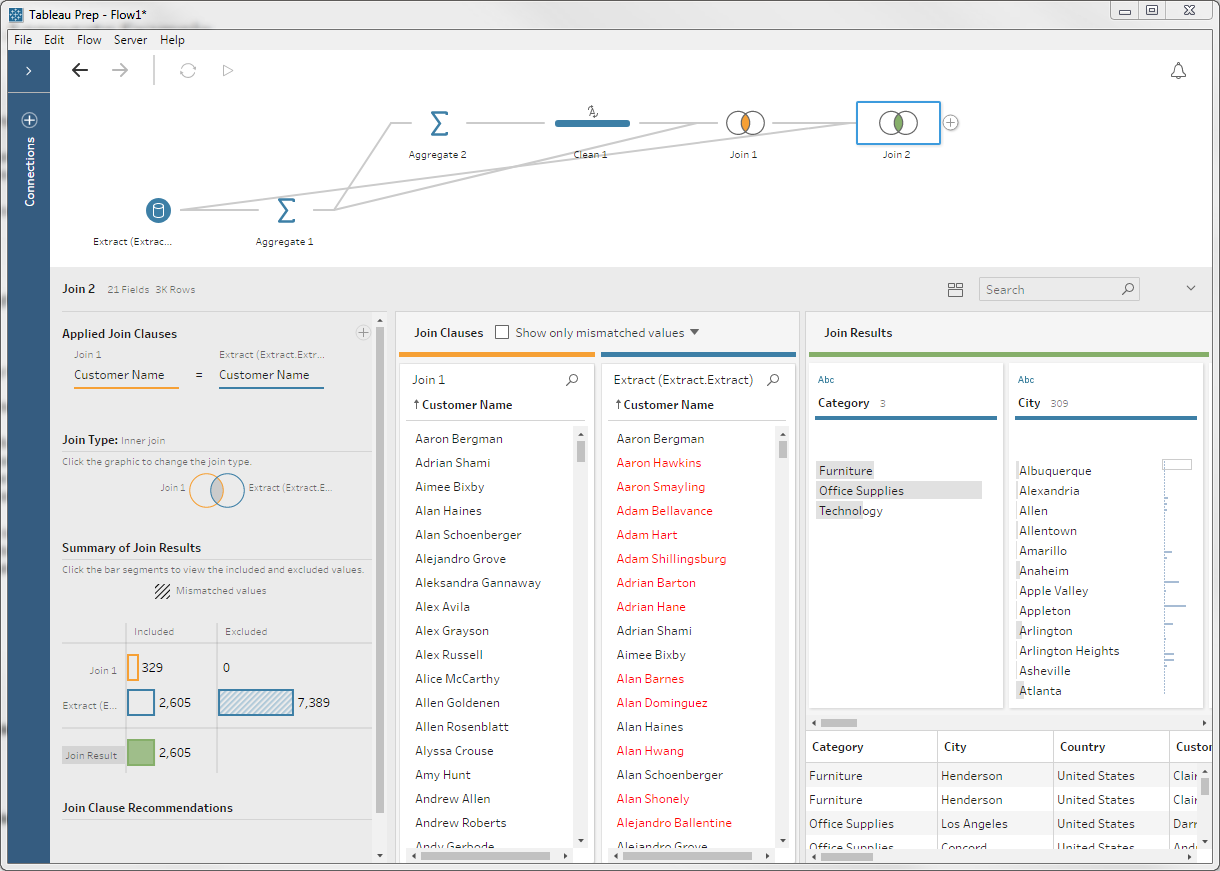
You can see that there are a bunch of records dropping out from the right: those were the customers with more than the median number of orders. What remain are the line items we care about: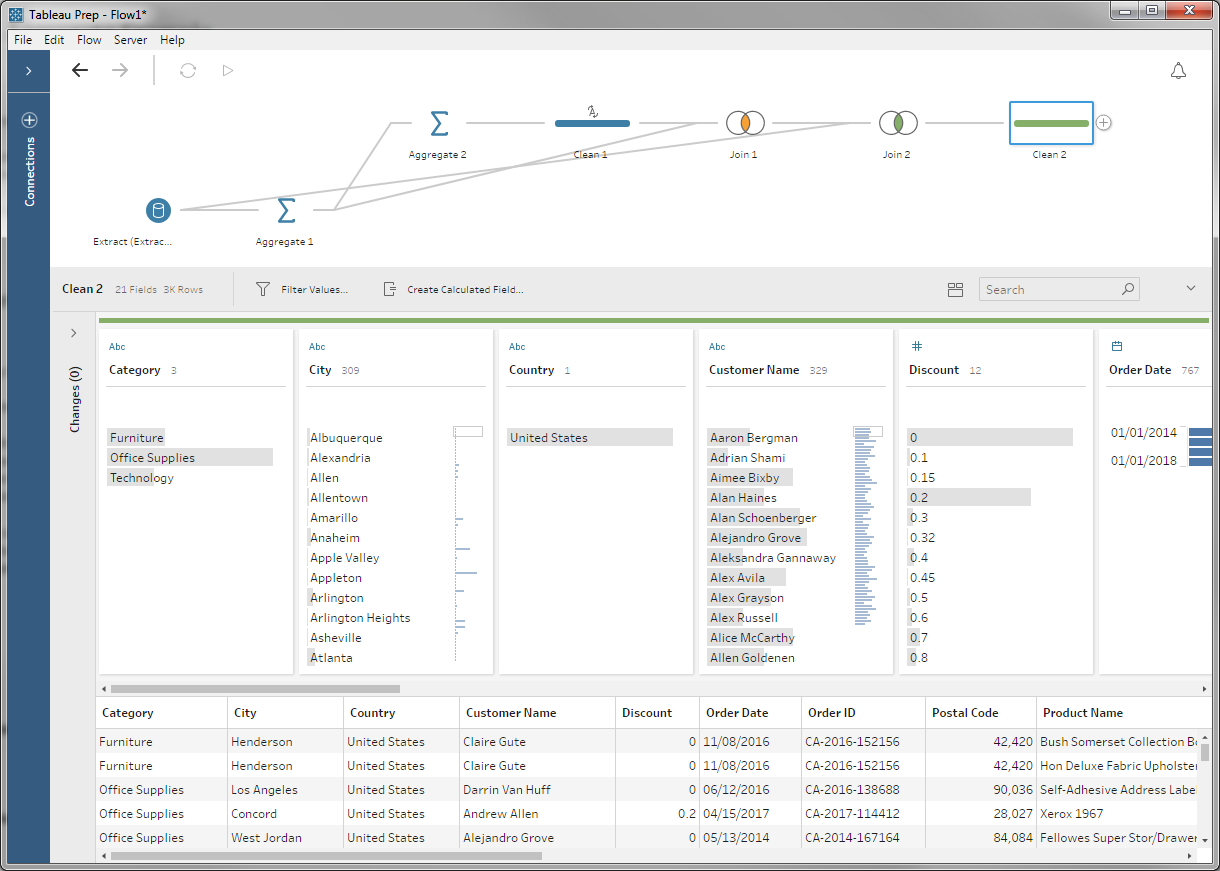
Wrapping Up
At this point, you might want to clean up a few of the columns we created along the way, but our data are ready to output to Tableau or anywhere else you want to take them.
This may seem a little complex — and it's clearly stretching our flow layout algorithm — but it makes a perfectly fine flow. There was no operator that solved our problem out of the box, but composability made it possible to mix-and-match the operations present to build a computational machines for our task.
We certainly aren't done adding operations to Prep, but there's a rich set already present. And with a little composition, you can make them do some pretty cool tricks.